The CRB appears to be rolling over. As this Great Graphic from Bloomberg shows, this popular index of commodity prices gapped lowed on Monday and took out last month's lows by a penny earlier today.
It is actually the second gap in as many weeks. It gapped lower last Monday (June 30). It is a small gap (310.12-310.46), but is has not been filled. That gap broke the steep uptrend and, according to gap theory, is likely a break away gap.
On the assumption that the gap created by Monday's sharply lower opening is not filled in the near-term, it would appear to be a measuring gap. It takes place, according to theory, near the middle of a move. That would project a move to the March-April lows (299.00-300.00), which is just above the minimum retracement objective (38.2%) of the rally from the year's low set on January 10 near 273.00.
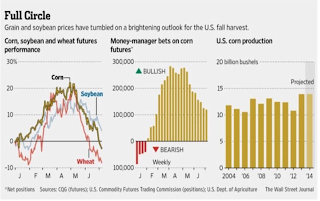
Of note, what appears to be ideal conditions for US grains has seen a sharp drop in prices. Corn, wheat and soybean prices are near 4-year lows. USDA reports that 75% of the corn crop and 72% of the soybean crop is rated in good or excellent condition. This compares to 67% last year for corn and appears to be the best for soybeans in two decades.
Although there is a small reduction of acreage under production (4.4%) for corn, farmers appear to have more plants per acre, allowing for a small increase in the anticipated overall harvest. US farmers may average about 182 bushels of corn per acre. On Friday, the new USDA forecast may boost the anticipated harvest, which is poised to be the second consecutive record.
The lower graph is from the Wall Street Journal. It gives a sense of the decline in prices shows how bulls have capitulated in the futures markets, while corn production is at record levels. Favorable weather helped. Precipitation in the parts of Illinois and Iowa, the heart of the soy and corn, was six times the normal amount and it came at a good time for the crops. Owing to the fact that wheat and corn may be fungible in animal feed, the crops often move together.
There are two take aways from this that are important for investors in stocks and bonds. First, supply is a more important driver than demand for the grains. This may seem obvious, many pundits have argued that the expansion of central bank balance sheets, or the easy money in general caused previous commodity rallies.
To be sure, the Fed buying $35 bln through the end of this month and will likely by $30 bln a month for the following six weeks. The BOJ continues to buy about $70 bln a month in assets. The ECB's balance sheet may expand by as much as 400 bln euros (~$544 bln) in the last four months of the year, it the TLTROs are fully subscribed. China, for its part, has redefined loan-to-deposit ratios and has reduced some reserve requirements. The point is that the large economies continue to provide liquidity, but it is not fueling commodity inflation.
The second important take away is that falling food prices do the euro area, Sweden and Switzerland no favors. Corn and wheat (December contracts) are off 22% and 24% respectively since early May. Soybeans (November contract) is off 13% since late May. The decline in grain prices may aggravate deflationary pressures.
Great Graphic: Bumper US Crop Frustrates Europe
 Reviewed by Marc Chandler
on
July 08, 2014
Rating:
 Reviewed by Marc Chandler
on
July 08, 2014
Rating:


