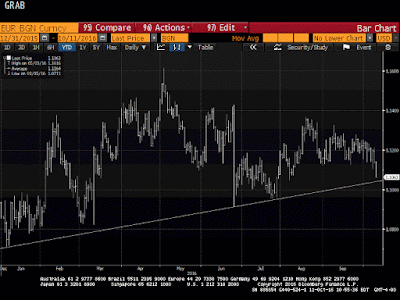
This Great Graphic, composed on Bloomberg shows the euro against the dollar since the start of the year. It shows the trendline drawn off the early-January and late-June lows. It catches the last July low. It is found today near $1.1035, just below the August low (~$1.1046).
Technical indicators, like the MACDs and Slow Stochastics, seem to favor a downside break. However, there is congestion around $1.10. The July low was seen near $1.0950 and the Brexit spike low was near $1.0915.
Another cautionary technical note comes from the Bollinger Band. The lower band is set two standard deviations from the 20-day moving average. It is found near $1.1105 today, meaning the euro is well through it. Prices sometimes move to the Bollinger Band, and sometime the Bollinger Band moves to prices. The point is that even though the market returns are not normally distributed, the euro has not spent much time outside of its Bollinger Band this year.
Fundamentally, the dollar's traction appears to be emanating from the interest rate market. The US 2-year yield has risen from near 72 bp on September 30 to 87 bp today, the highest since early-June. The US premium over Germany has widened to 154 bp today, the most since the mid-2006. In the first part of October 2015, the US premium was less than 90bp. The US premium for 10-year money is 243 bp over Germany. This is the most mid-April.
Partly the rise in US yields reflect growing confidence of a Fed hike before year end and acceptance that price pressures are likely to increase. Many observers expect that there will be more fiscal stimulus regardless of the election results.
Disclaimer
Great Graphic: Euro is Approaching Year-Long Uptrend
 Reviewed by Marc Chandler
on
October 11, 2016
Rating:
 Reviewed by Marc Chandler
on
October 11, 2016
Rating:


